

Key Takeaways
Price History Tool
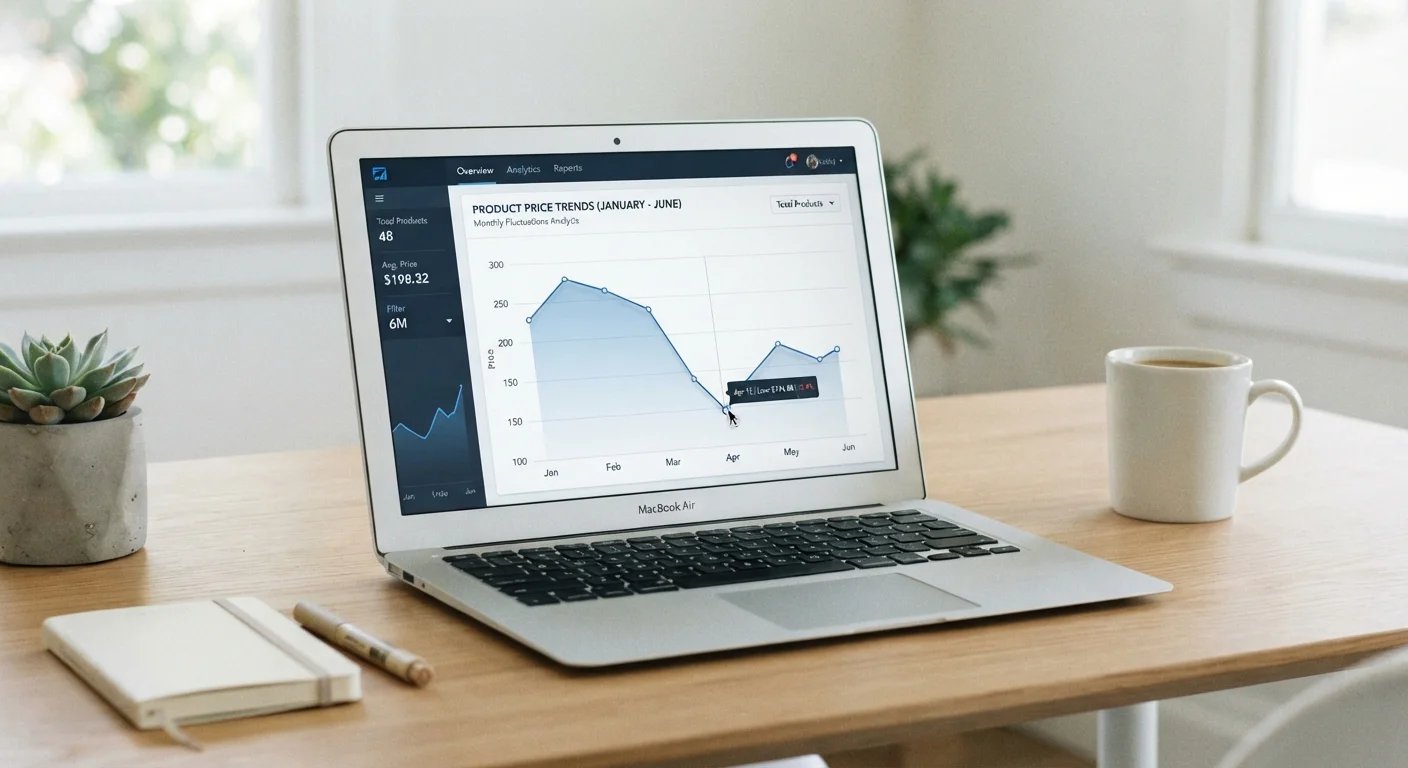
A price history tool is a service or browser extension that tracks how the listed price of a product has changed over time on one or more retail websites. It presents that data as a chart or table, so shoppers can see whether a current "sale" price is genuinely lower than usual or simply the product's normal price with a discount badge attached. Most tools store historical pricing data automatically and require no manual input from the user.
Many tools query retailer APIs or scrape product pages at regular intervals - sometimes hourly - storing timestamped price snapshots in a database that powers the chart you see.
What Problem Price History Tools Solve
Retail pricing is not static, and it is not always honest. A product page displaying "30% off" communicates very little on its own - off what baseline, set when, for how long? Retailers frequently adjust reference prices upward in the days or weeks before a promotional event, meaning the discount percentage can be technically accurate while the actual price paid is unchanged or even higher than normal.
Price history tools address this directly. By logging price data over time and presenting it visually, they answer the question that a discount badge never will: is this price actually low relative to what this product has cost before? That single shift in framing - from "how much am I saving off list?" to "where does today's price sit in this product's history?" - changes how a shopper evaluates a purchase decision.
Understanding the real difference between a sale price and a good price is the foundation this tool category is built on. Historical data makes that distinction concrete rather than abstract.
~60%
Of major sale prices not at true lows
Analysis by price tracking platform Camelcamelcamel and consumer research groups has consistently found that a significant share of prices marked as "sale" during major retail events are not at their historical lows for that product.
Hourly
Typical price-check frequency for leading tools
Several major price history tools refresh pricing data as frequently as every hour for high-traffic product listings, allowing the database to capture short-lived price changes.
How Price History Tools Actually Work
Most price history tools operate through automated data collection. A crawler or API integration visits a product page at scheduled intervals - sometimes every few hours - and records the listed price alongside a timestamp. Over weeks and months, those snapshots build a dataset that powers a price chart visible to any user who looks up that product.
From the shopper's side, the process is straightforward. Browser extensions install in seconds and surface a price chart directly on a product page without requiring navigation away from the retailer's site. Standalone web tools accept a product URL and return the same data. Some platforms also support email alerts: a shopper enters their target price, and the tool sends a notification when that threshold is reached.
It is worth understanding what this data does not include. Most tools track the price for one retailer's listing of one product version. Prices at competing retailers, in-store pricing, bundled configurations, or third-party marketplace sellers on the same platform may not be reflected. Comparing prices across channels and formats is a separate skill that complements price history but is not replaced by it.
Reading the Data: What Patterns to Look For
A price history chart is most useful when you know what to look for rather than simply checking whether the current price is at the bottom of the graph.
- The price floor: The lowest price the product has reached in the tracked period. If today's price matches or comes close to this floor, the deal has genuine historical backing. If it sits near the top of the range, the "discount" is questionable.
- Price spikes before major sales events: Look for sudden upward movements in the weeks preceding promotional holidays. A spike followed by a "discount" back to the prior normal price is a common pattern.
- Frequency of drops: If a product reaches a low price every few weeks, waiting may be a reasonable strategy. If the price has only dipped once in a year, acting on that dip makes more sense.
- Trend direction: Some product categories trend downward over time as newer models arrive. Electronics and appliances often follow this pattern. A price that looks low today may be average in three months.
For a deeper walkthrough of how to interpret these charts, see reading a price history chart before you buy. Pairing that skill with an understanding of when categories typically see genuine price drops adds useful seasonal context to the data.
Set a Target Price Before You Look at the Chart
Before pulling up a price history chart, decide what you would genuinely be willing to pay for the product based on your budget and needs. Anchoring to your own number first prevents the chart from simply replacing the retailer's anchor with a new one. If the historical low is still above your threshold, that is meaningful information - the product may not be the right fit at any price it has reached so far.
Practical Limits and How to Account for Them
Price history data is a strong input into a purchase decision - not a guarantee of outcome. A few limitations are worth keeping in mind as you incorporate these tools into your shopping habits.
Coverage gaps: Smaller retailers, specialty stores, and direct-to-consumer brands are often not tracked. If a product is only sold through one of these channels, price history tools may offer little or no data.
Marketplace complexity: On large platforms where multiple third-party sellers list the same item, price history tools may only track the featured or default seller's price. The lowest available price at any given moment may come from a different seller not captured in the chart.
Quality and version differences: A price drop may coincide with a change in product configuration - a different size, an older model number, or a reduced bundle. Always verify that the product specification you need matches what the price history is tracking.
Used with those caveats in mind, price history tools remain one of the more reliable free resources available to shoppers who want to move past gut instinct and toward evidence. How historical data changes what you're willing to pay explores the broader behavioral dimension of this shift - worth reading alongside the mechanical how-to.