

Key Takeaways
Price Tracking
Price tracking is the practice of recording a product's listed price at regular intervals over time to build a historical record of how that price has moved. Shoppers and tools use this data to evaluate whether a current price is genuinely low relative to what the item has sold for in the past. It shifts purchasing decisions from gut feeling to evidence.
Most price tracking tools collect data through automated web scrapers that log prices at set intervals - sometimes hourly - and store the results in a queryable database tied to a specific product identifier such as a retailer's SKU or a universal barcode.
Why a Single Price Snapshot Isn't Enough
When a retailer marks an item as 30% off, that discount is measured against a reference price the retailer chose. That reference price may reflect a brief period when the item was listed higher, or it may simply be an inflated anchor designed to make the current price look attractive. A shopper relying only on what they see today has no way to know which scenario applies.
This is the core problem price tracking solves. Instead of a single data point, it provides a timeline - showing not just what a product costs right now, but what it cost last week, last month, and last year. That context fundamentally changes how you interpret a price tag. For a deeper look at how retailers construct pricing signals, see why prices shift across the calendar.
~2.5M
Price changes on Amazon per day (estimated)
Research by pricing analytics firms has documented that major online marketplaces update product prices millions of times daily, making any single observation unreliable without historical context.
Over 60%
Shoppers who check prices before purchasing
Consumer surveys consistently find that a strong majority of online shoppers compare prices across at least two sources before completing a purchase, reflecting broad awareness of price variability.
How Price Tracking Actually Works
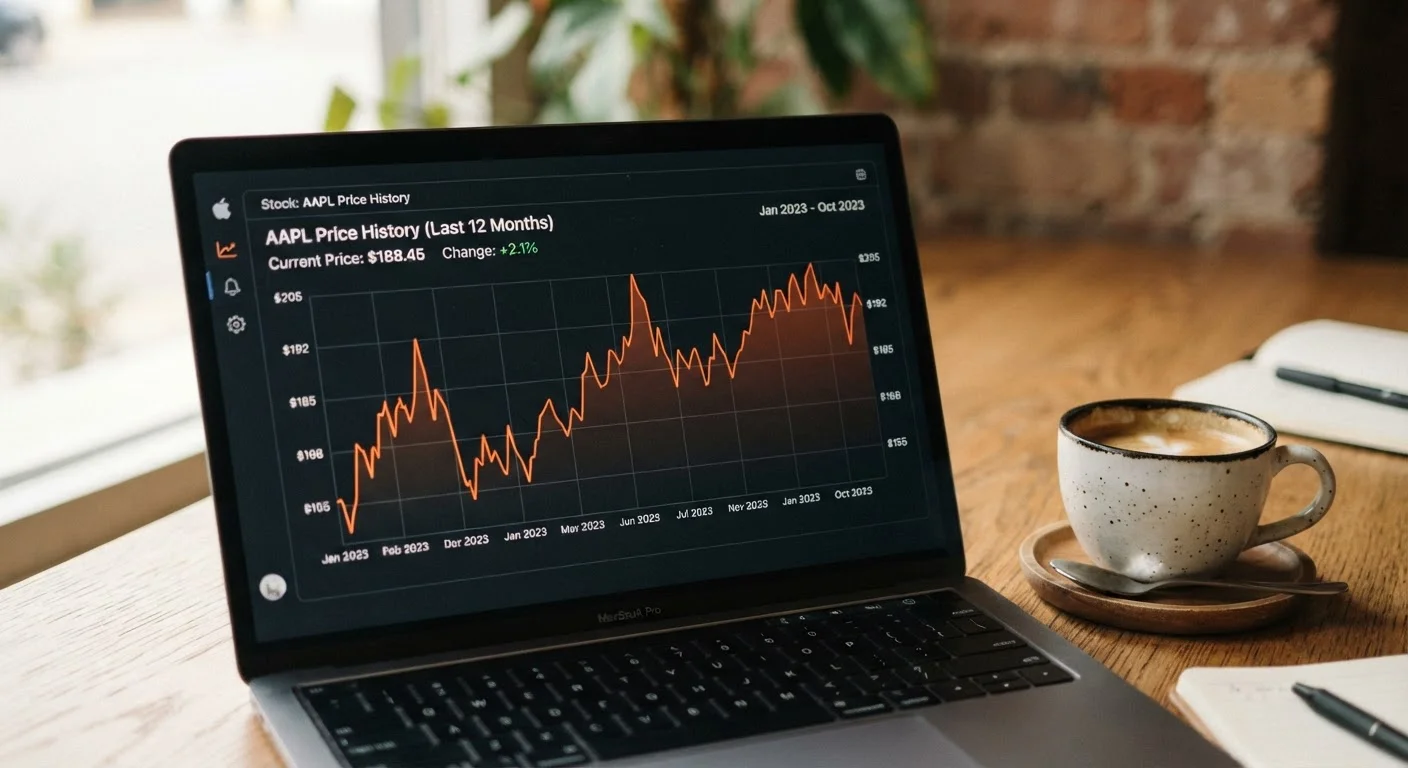
Price tracking tools - whether browser extensions, dedicated websites, or retailer-specific features - work by repeatedly querying a product's listing page and logging the price at each interval. Over time, these logs form a dataset that can be visualized as a chart, showing price movement across days, weeks, or months.
Most tools tie their records to a specific product identifier, so the history follows a particular item rather than a broad category. When you look up a product, the tool retrieves its stored history and displays it alongside the current price, often highlighting the all-time low, the 90-day average, and whether today's price sits above or below that average.
For a practical walkthrough of what these charts show and how to read them, reading a price history chart before you buy offers a clear guide.
Price History Covers Listed Price, Not Final Cost
Most price tracking tools record the advertised selling price, which may not include shipping, taxes, or marketplace fees. A product that appears cheaper based on its tracked price history could still cost more in total once those additions are applied. Always factor in the full transaction cost when using historical data to evaluate a deal.
When Price History Is Most Useful
Price tracking adds the most value for considered purchases - items you can afford to wait on and that have predictable pricing patterns. Consumer electronics, kitchen appliances, bedding, and fitness equipment all tend to cycle through sales events tied to holidays, back-to-school periods, or model-year transitions. A historical chart can reveal these cycles clearly, showing that a product reliably dips in price at certain times and rebounds afterward.
It is less useful for perishables, frequently restocked basics with stable pricing, or situations where you need an item immediately. In those cases, the practical value of waiting for a better price based on historical data is limited.
Price history also intersects with the broader question of where you buy. Online prices are not automatically lower than what you'd find in a store - dynamic pricing, shipping fees, and marketplace markups can all erode the apparent savings. Why online prices aren't always lower than in-store explores this in detail.
What Price History Can and Cannot Tell You
Historical price data is a powerful reference point, but it has real limits. It tells you what a price has been - not what it will be. A product that hit a record low during a specific clearance event may never reach that price again. Conversely, a product that appears expensive today may drop soon if a new model is releasing or inventory is building up.
Price history also can't account for product changes. A retailer may list a newer version of a product under the same listing, making historical prices less comparable. Or the item may have shifted between sellers on a marketplace, with the history reflecting prices from multiple different sources.
Used well, price history is one input among several - alongside channel comparisons and timing research. Smart habits for comparing prices across channels provides a framework for combining these inputs into a reliable purchase decision.